Next: Templates for Your Project Up: Choosing an Alternative Report Previous: Integrating New Report Plugins
myReport2 <- function(spotConfig) {
spotWriteLines(spotConfig,2," Entering spotReportDefault");
rawB <- spotGetRawDataMatrixB(spotConfig);
print(summary(rawB));
mergedData <- spotPrepareData(spotConfig)
mergedB <- spotGetMergedDataMatrixB(mergedData, spotConfig)
my.lm <- lm(y ~ ., data= rawB)
print(summary(my.lm))
par(mfrow=c(2,2))
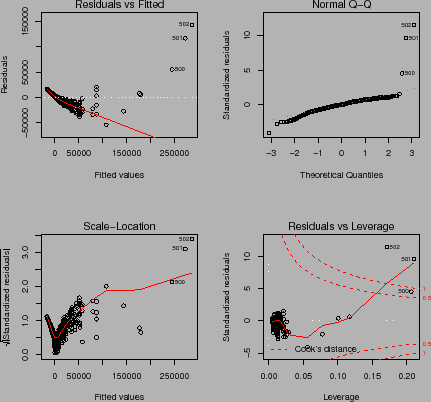
plot(my.lm)
x11()
library(effects)
x11()
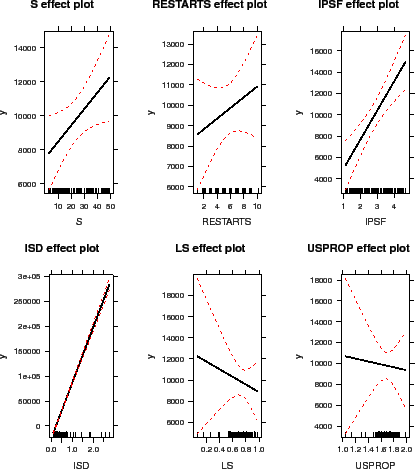
plot(allEffects(my.lm), ask=FALSE)
###
x11()
C1 = spotWriteBest(mergedData, spotConfig)
C1 = C1[C1$COUNT == max(C1$COUNT), ]
xNames <- setdiff(names(rawB), c(spotConfig$alg.resultColumn,
"y"))
B <- NULL
nsens = 20
for (i in 1:nsens) {
B <- rbind(B, data.frame(C1[1, xNames]))
}
fit <- randomForest(rawB[, xNames], rawB$y, ntree = 100)
rwb <- cbind(spotConfig$alg.roi, t(B[1, ]))
names(rwb)[length(rwb)] <- "BEST"
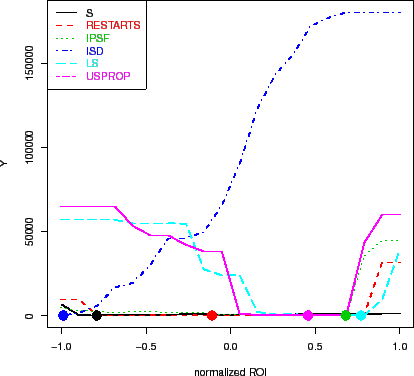
Y <- spotReportSensY(B, fit, spotConfig$alg.roi, nsens)
X = seq(-1, 1, length.out = nsens)
matplot(X, Y, type = "l", lwd = rep(2, ncol(Y)), col = 1:ncol(Y),
xlab = "normalized ROI")
XP = (rwb$BEST - rwb$low)/(rwb$high - rwb$low) * 2 - 1
XP = rbind(XP, XP)
YP = min(Y)
YP = rbind(YP, YP)
matpoints(XP, YP, pch = rep(21, ncol(Y)), bg = 1:ncol(Y),
cex = 2)
legend("topleft", legend = names(Y), lwd = rep(2, ncol(Y)),
lty = 1:ncol(Y), col = 1:ncol(Y), text.col = 1:ncol(Y))
cat(sprintf("\n Sensitivity plot for this ROI:\n"))
print(rwb)
cat(sprintf("\n Best solution found with %d evaluations:\n",
nrow(rawB)))
print(C1[1, ])
spotWriteLines(spotConfig, 2, "\n Leaving spotReportSens")
}
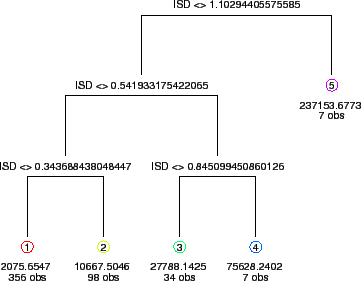
Figs. 7 - 10 show some results from the report plugin myReport2.R.